A blog about smart marketing and conversion optimization.

Are display ad exchanges full of conversions, or just full of it?


When it comes to running display advertising on the web, there are finite publishers, but hundreds of display ad networks who promise to run your banner ads with the best chance of conversion, the hottest technology and the most efficient algorithm.

Whether you call them ad exchanges or programmatic display advertising, there is one key question that plagues digital marketing managers who hear ad network reps beating the drum in oneRead more…

Continue reading >


When it comes to running display advertising on the web, there are finite publishers, but hundreds of display ad networks who promise to run your banner ads with the best chance of conversion, the hottest technology and the most efficient algorithm.

Whether you call them ad exchanges or programmatic display advertising, there is one key question that plagues digital marketing managers who hear ad network reps beating the drum in one ear and upper management expecting measurable results in the other. That question is: does display advertising really work?

By that, I mean, is there tangible, incremental conversion lift coming from the display ads you run with Rocket Fuel, Quantcast, Chango and the like?

This post attempts to unpack how success is measured, what red herrings often crop up and how you can really get to the bottom of display advertising’s contribution to your company’s top line.


Defining the jargon in display

Clicks-through and view-through conversions, multi-touch attribution — what does it all mean?

Let’s quickly define our terms.

  1. Your customer sees a display ad or banner ad. S/he clicks on it and converts. That’s a simple click-through conversion.
  2. Your customer visits a page where your display ad is shown, but does not click on it. Later, s/he converts. That’s a view-through conversion.
  3. Because view-throughs are measured based on whether the ad loaded on your customer’s computer, we don’t really know if your customer saw the ad, consciously or subliminally. It might’ve loaded at the bottom of the site, while s/he never scrolled that far. To get at this calamity, there’s a metric called viewability that some tools attempt to measure. It answers the question: was your ad actually viewed? Or did it just load somewhere on the page, falling on deaf ears, so to speak?
  4. The traditional conversion path used to be measured against simple click-through conversions. Whichever ad or channel had the last touch, or the last click, that led to your customer converting — that was the channel that got credit. That’s last-touch attribution.
  5. The new(er) hypothesis about complex advertising programs that touch a customer at many different moments on the way to a conversion — let’s say your customer saw a banner ad but didn’t click, then Googled your brand name, then searched for coupons, and finally converted on a newsletter click — the perspective that considers all of these touches and gives some equity to all of them is called multi-touch attribution.

So what’s the right way to understand whether display ads are working? Should we spend thousands of dollars to implement multi-touch attribution technology, or apply Draconian rules that only reward channels for closing the deal with a customer on the final click?

It’s a confusing problem. But you have options to measure what’s going on in your conversion funnel.

Here are some things you can do to truly measure the impact of display.


A/B test your ads against a placebo

There is something called a Public Service Announcement (PSA) test. In this experiment, you serve your display ads to 50% of your audience — business as usual — but the other half of your audience is shown a placebo. This half sees a PSA. One former client, for example, used a “Smokey the Bear” ad about preventing forest fires.

This type of test can take some time to gather meaningful data — it can take a month or more and be quite costly — but the results will demonstrate whether the potential customers who saw your real display ads have a higher propensity to convert than those who saw Smokey the Bear.

Consider this example of a real PSA A/B test we ran on behalf of a client in the home decor e-commerce sector.

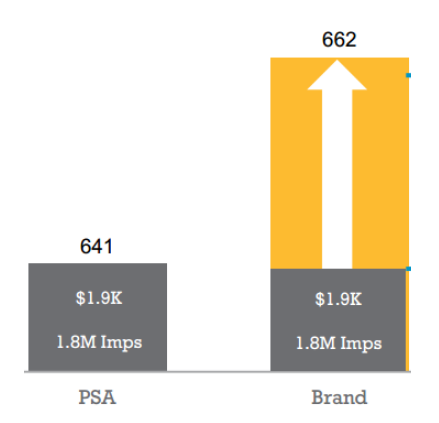
Here’s what we uncovered by running this PSA test with Quantcast, an advertising partner:

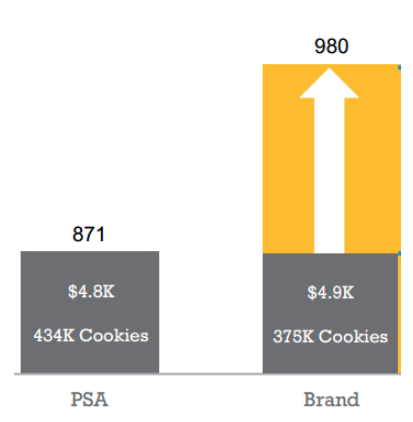
The “Brand” group of ads, meaning the client’s regular ads, yielded 980 conversions (these are view-throughs) while prospects who saw Smokey the Bear ads converted 871 times.

When you factor in the number of cookies — in other words, how many times each ad was shown — the regular ads brought in 30% more conversions than Smokey the Bear. For you marketing statisticians, the confidence level here was 95%. You can find more info on statistical significance and what it means for marketers here.

Is this a good result? On the one hand, it’s nice to see 30% incremental conversions. On the other hand, what should we make of the fact that almost 900 people saw Smokey the Bear and converted anyway? Is the handful of incremental conversions enough to justify the display ad spend here?

For this particular client, it wasn’t.

We didn’t only test IAB-standard display ads as shown above. We also tested ads on the Facebook Exchange. There, we found no statistically significant conversion difference between the client’s real ads and PSAs.

This type of testing is one way to assess value. Advanced attribution tools are another.

Advanced attribution technology

If you’re touching prospects on many levels and via multiple channels, some experts argue you’ll benefit from an advanced attribution platform. This technology takes into account all the touches that contribute to a single conversion and algorithmically estimate how each channel fits into the larger whole.

Convertro is one such tool. It’s useful for estimating how many real conversions a given channel is contributing based on all the (possibly hundreds) of touchpoints in the sales cycle.

It can also show you data like this:

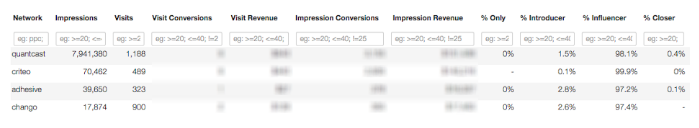
What we found interesting was the tool’s ability to show how often a given ad network played the role of Introducer (meaning that the ad network served the very first ad this prospect saw in your sales funnel), Closer (the ad network showed the last ad viewed or clicked by the prospect before converting), or Influencer (the ad network participated somewhere between introduction and conversion).

This breakdown can be useful in thinking about how important each ad partner is when it comes to guiding prospects to eventually buy.

The table above tells us that the ad networks pictured here acted as an influencer 97% of the time. That means they weren’t likely to be sourcing brand new prospects or “closing the deal” with soon-to-be customers, but probably contributed awareness along the way.

Last-click attribution

The conservative play when it comes to evaluating many different channels is to give maximum weight to last-click conversions and revenue.

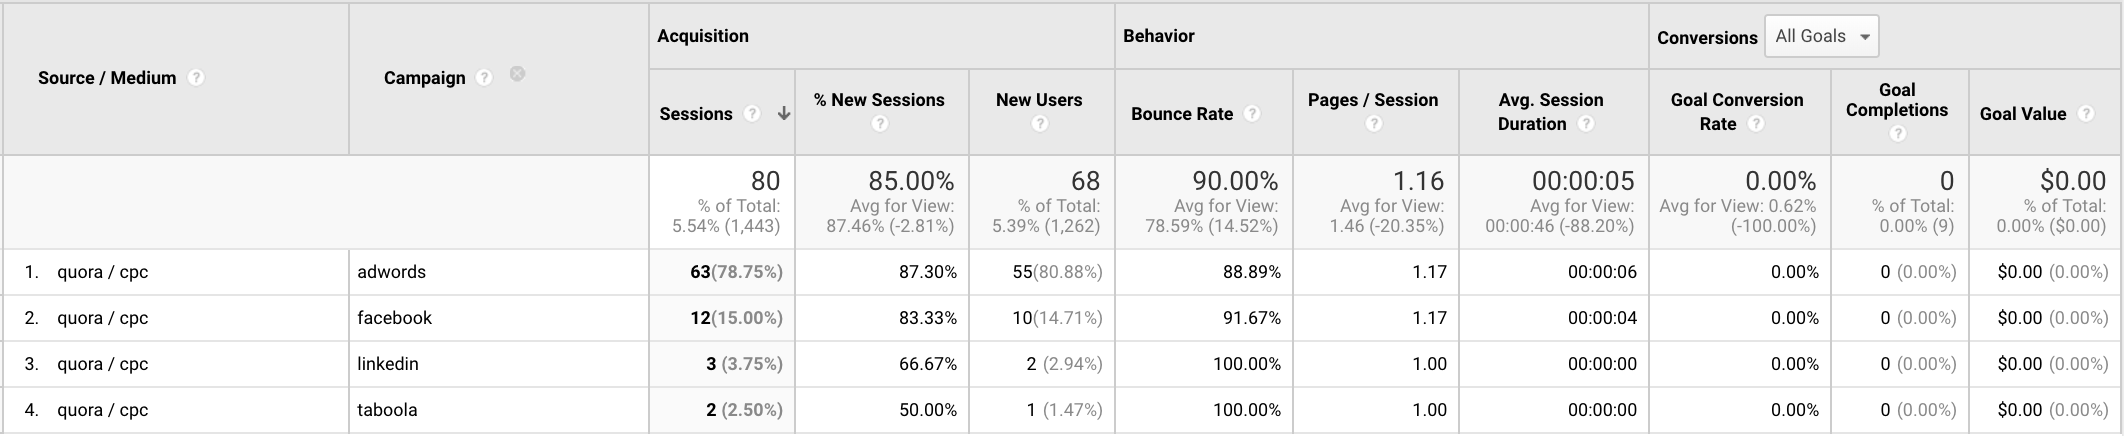
That’s because only one lucky ad or channel can be responsive for the final click or view before a conversion. If you credit each channel with view-throughs, you might be praising multiple channels for the same conversion. But using a tool like Google Analytics to report on conversions and revenue from a given traffic source will, in the traditional view, tell you which channel drove the last click. Revenue resulting from each channel will be counted exactly once.

Some experts argue that last-click attribution has gone out of style and a more holistic view is in order for how prospects interact with your business on their journey through the conversion funnel. It’s true that tracking ROI has become more complex with the advent of drip campaigns, inbound marketing and many kinds of interactive ads. Still, a more rigid reading of the analytics can offer checks and balances against overspending.

The best thing you can do for your business is to look at attribution in more than one way. If you can afford a PSA A/B test, it’s quite informative (and in our example case, quite sobering). Otherwise, assessing ad network performance via multiple free tools will give you more insight than simply trusting the dashboard of your ad partner(s). With several perspectives at your disposal, it’s easier to make a call on which channels should be expanded and which can be cut.


...Read less

2019 LinkedIn Ads feature update: Lookalike Audiences & how to use them

LinkedIn Ads has finally started to introduce a Lookalike Audiences feature, and we’re going to tell you all about it.

If you’re familiar with Lookalike targeting, feel free to skip the flowery introduction and head straight for the good stuff below. But for everyone else, here’s a deep thought.

So you’ve got a customer — or even many customers — and you know a surprising number of things about them. You know their age and gender, theirRead more…

Continue reading >

LinkedIn Ads has finally started to introduce a Lookalike Audiences feature, and we’re going to tell you all about it.

If you’re familiar with Lookalike targeting, feel free to skip the flowery introduction and head straight for the good stuff below. But for everyone else, here’s a deep thought.

So you’ve got a customer — or even many customers — and you know a surprising number of things about them. You know their age and gender, their ballpark annual income, where they live, what they like to do for fun. You’re no stranger to basic demographics and behavioral data.

So you’re wondering: how do I reach more people like these people, and compel them to buy from my business?

This is where the idea of lookalike audiences feels pretty intuitive.

Why not use technology to study a company’s existing customers or target audience, and enable that company to reach a broader audience who fits similar demographic trends?

For many advertisers, Lookalike capabilities in the LinkedIn Ads platform aren’t a big surprise; they’re what is expected. Facebook, for example, has had this feature since early 2013.

LinkedIn has started to roll out Lookalike Audiences in their new dashboard to select advertisers and is aiming to have it live for all advertisers by the first week of April 2019.

LinkedIn is known for being slow to roll out new features. Matched audiences and remarketing only went live in 2017. Since the acquisition of LinkedIn by Microsoft, there have been a slew of updates to the platform, including a new dashboard, carousel ads, video, Lookalike Audiences and more.

Before this rollout, there has been a little-known hack advertisers could use in order to run a makeshift Lookalike Audience on LinkedIn.  This is done by adding a matched audience, targeting and excluding this audience in your campaign, then enabling the audience expansion option.  Not the most seamless approach, but it worked.

In this post, we’ll be digging into the new Lookalike Audience feature set and how to use it directly in the LinkedIn Ads dashboard.

How do Lookalike Audiences work?

Lookalike Audiences are a way to leverage your current customers/audiences (using either an email list of contacts, pixel-based data or a CRM data integration) to reach a broader set of potential customers who are demographically and behaviorally similar.

The LinkedIn Ads platform will identify trends across your existing target audience (using data like company, industry, job experience, skills and other info) and find similar sets of users on LinkedIn. You can also find companies similar to the ones you’re targeting.

These audiences can be added to your campaigns and refined through other LinkedIn targeting options.

How do I create a Lookalike Audience with LinkedIn Ads?

Starting in LinkedIn Campaign Manager, follow these steps:

  1.  Set up a website audience, contact list, or account list from the “matched audience” page.

Tip:  Try to use a larger list size, as your lookalike audience will likely average 5-10x the size of your seed list.

  1.  Check to see if your audience is in the ‘ready’ state, then select the ‘people’ icon pictured below to begin processing your Lookalike Audience.


Tip:  You’ll have to wait up to 48 hours from the time you upload your list – be patient!

  1.  Select “create campaign” to create a new campaign that will house your new audience.

  1.  Select your campaign objective from the list.

  1.  Add your Lookalike Audience to the campaign.

Tip: You can refine your audience further using other LinkedIn targeting options.

Which data source is best for Lookalike Audiences?

LinkedIn allows you to generate a Lookalike Audience using an email list, pixel data or CRM integration.

Here are a few options and examples of good data sources to use:

    A list of customers uploaded from your CRM, i.e. Salesforce

    Website visitors who landed on the customer login page

    Email addresses of leads who have downloaded an eBook

    People who visited a key page (i.e. your company’s pricing page)

    A list of target accounts handpicked by sales

    A list of your top revenue-generating customers

Both list quality and quantity are important. Although a list of your most valuable revenue-generating customers might be of the highest quality, the list size might not be large enough.

The list size must have a minimum of 300 matched members.  The base list size must be larger than 300, as not every email address will be matched to a LinkedIn account (the number of matched members divided by the total number of imported emails is called your ‘match rate’).

Best practices for LinkedIn Lookalike campaigns

    Test multiple audience types, as no two audiences will perform the same.

    Test a website-based audience vs. list-based audience to discover what performs best.

    Identify an audience for each phase of the funnel. Consider a homepage-based campaign for brand awareness and a lead page for lower funnel campaigns.

    Review campaign demographics to discover engaging lists or website audiences.

    Limit any additional audience refinements as this will lower your audience size.

    Larger lists are better and you need at least 300 matched members to use Lookalike Audiences.

Considering Facebook Ads results across the board, Lookalike Audiences are a generally successful targeting strategy for B2C campaigns but have their weaknesses in the B2B realm (this makes sense as Facebook uses data less geared toward a user’s career). Since LinkedIn provides exclusive access to its users in a professional context, we expect Lookalikes via LinkedIn Ads to be a huge win for B2B advertisers.

...Read less

What’s the right budget for testing a new ad channel?

When it comes to testing a new advertising channel, or planning a broader pilot for fresh online ad initiatives, one question clients invariably ask the experts at Clever Zebo is: how much should I expect to spend?

The short answer is: you can usually learn a lot about how an ad channel will perform with just $1,000 to $2,000 in advertising spend, given that certain conditions are met.

  1. Tracking. You have installed native tracking code forRead more…
  2. Continue reading >

When it comes to testing a new advertising channel, or planning a broader pilot for fresh online ad initiatives, one question clients invariably ask the experts at Clever Zebo is: how much should I expect to spend?

The short answer is: you can usually learn a lot about how an ad channel will perform with just $1,000 to $2,000 in advertising spend, given that certain conditions are met.

  1. Tracking. You have installed native tracking code for the ad platform being tested, and tested the code to ensure it’s installed correctly.
  2. Analytics. You have an analytics tool in place that represents the broader “truth” around data for your website visits. This is important because it gives you an apples-to-apples picture of the data for multiple ad channels (and organic traffic channels). It’s also key to measuring success because it allows you to look at softer metrics like visitor engagement, time on your website, average pages per session, bounce rate, etc. The native tracking code, by contrast, will only tell you when visitors have converted.

Here’s what you can expect to see after spending $1-2k to test an ad platform.

  • Clues about which targeting and campaigns are showing promise
  • Indications of the ad messaging that resonates with your audience in an A/B test
  • Hopefully, real conversions and some insight into their quality
  • At minimum, some data around which campaigns and audiences lead to strong engagement

I’ll share some real data from our Quora Ads campaign analytics to illustrate this last point.

You can see below that we spent about $85 for a total of 120 clicks, most of which came from ads promoting our Google AdWords management services. We saw 20 clicks for Facebook Ads management services, and just a handful of impressions around our work managing LinkedIn Ads and Taboola campaigns. There wasn’t as much traffic on Quora questions surrounding those topics.

When you consider how valuable a real lead is for an online marketing agency, given our client retention rates, these CPC figures seem quite reasonable, averaging just $0.72.

But the soft metrics we saw in Google Analytics tell a different story about just how “real” these potential leads might be.

By any measure, visitors who are spending 6 seconds or less on a website are not very engaged with the content.

You can imagine how some advertisers might learn a lot by comparing specific audiences and campaigns by the engagement stats Google Analytics shows for a certain ad platform.

So which ad platforms should be part of a well-rounded online advertising pilot?

Depending on your product or service, it could make sense to test:

  • Google AdWords
  • Facebook Ads
  • LinkedIn Ads
  • Quora Ads
  • Outbrain and/or Taboola
  • Programmatic networks and exchanges (e.g. AdRoll, Rocket Fuel, DoubleClick)

I’ve developed a handy Google Sheet that we sometimes use to help clients divvy up their ad budget between relevant channels.

See the modeling tool >>

Using the above modeling tool for projections and guesstimates, you can try adjusting different variables like Avg. CPC and conversion rate by channel, and see how this would influence the CPA / CPL and conversion figures resulting from your advertising pilot.

Does $1-2k reflect the full budget a company should expect to spend on ads? Of course not. As you start to establish baselines and a picture of realistic performance, you can make decisions about channel-by-channel budget that makes sense for your business. But this modest investment amount represents a good pilot to test and learn what impact certain ad channels can have on your business.

...Read less